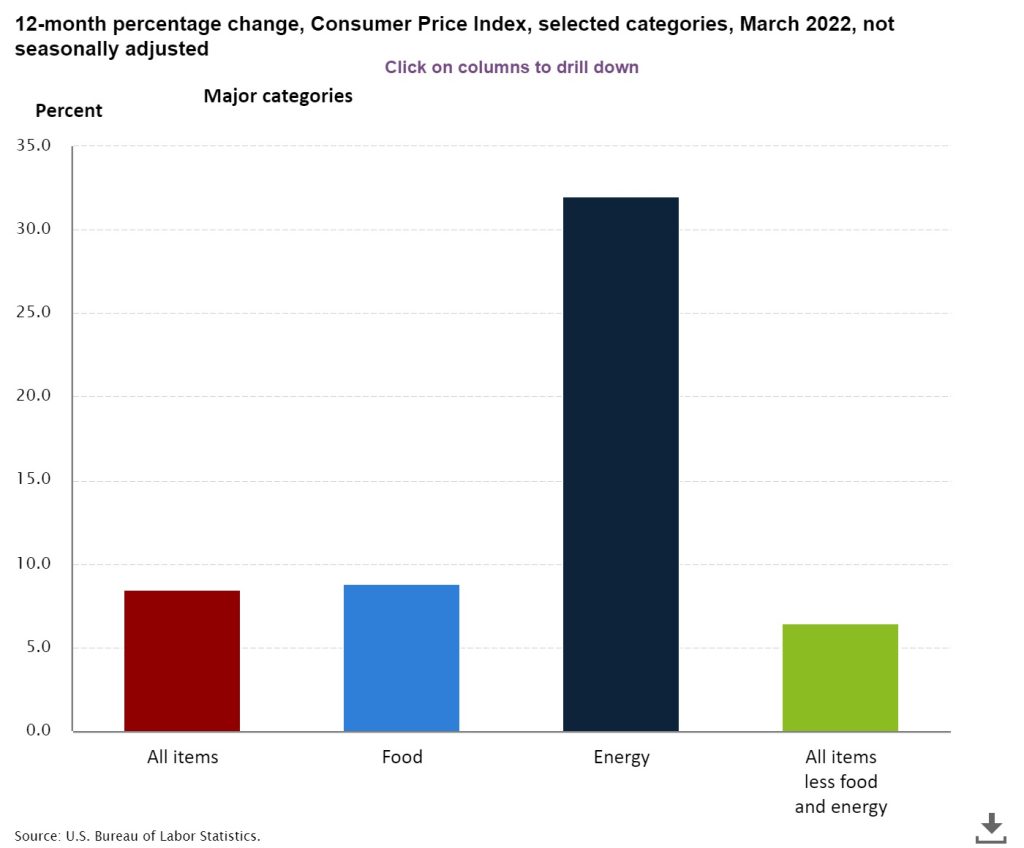
WASHINGTON D.C., April 13, 2022 – Yesterday, the U.S. Bureau of Labor Statistics announced that consumer inflation rose to a 40-year high of 8.54% in March, up from 7.87% in February. The Consumer Price Index for All Urban Consumers (CPI-U) increased 1.2% from February to March.
According to the latest CBS News/YouGov survey conducted between April 5-8, with a nationally representative sample of 2,062 U.S. adults, 73% ±2.8% stated that inflation is a high priority that should be addressed.

Americans have not experienced such high consumer inflation since December of 1981. The all items less food and energy index rose 6.5 percent, the largest 12-month change since the period ending August 1982. The energy index rose 32.0 percent over the last year, and the food index increased 8.8 percent, the largest 12-month increase since the period ending May 1981.
Inflation on gasoline at 18.3% comprised half of the CPI’s increase. Increases in the indexes for shelter and food round up the largest contributors to the increase.


The March 2022 CPI-W (used in Social Security Cost of Living Adjustment [COLA] calculations, hit a four-decade high of 9.36%, up from 8.60% in February 2022 according to ShadowStats.com.
The April 2022 Consumer Price Index for the Seattle-Tacoma-Bellevue area is scheduled to be released on May 11, 2022. However, to view the April 6, 2022, economic summary report for the Seattle area, click here.
“Correct” Inflation Calculations for March 2022
The CPI-U (consumer price index) is the broadest measure of consumer price inflation for goods and services published by the Bureau of Labor Statistics (BLS). It measures the change in prices paid by consumers for goods and services. The methodologies in calculating inflation have shifted over the years – once in 1980s and the other in 1990s. These changes in calculations have depressed reported core inflation now used by BLS.
In the chart below, ShadowStats.com, offers alternatives to government economic statistics for the United States, shows SGS-Alternate CPI estimates based on the methodology which was employed prior to 1980. Many economists argue that this provides an apples-to-apples comparison to core inflation currently calculated by BLS.

According to ShadowStats.com, actual inflation based on the 1980 calculation would be “17.15% [up from 16.05% in February], the steepest inflation rate since June 1947 (in 75 years).”
Real Earnings – March 2022
Real average hourly earnings for all employees decreased 0.8 percent from February to March, seasonally adjusted, the U.S. Bureau of Labor Statistics reported. This result stems from an increase of 0.4 percent in average hourly earnings combined with an increase of 1.2 percent in the Consumer Price Index for All Urban Consumers (CPI-U).
Real average hourly earnings decreased 2.7 percent, seasonally adjusted, from March 2021 to March 2022.
Real average hourly earnings for production and nonsupervisory employees decreased 0.9 percent from February to March, seasonally adjusted. This result stems from a 0.4-percent increase in average hourly earnings combined with an increase of 1.4 percent in the Consumer Price Index for Urban Wage Earners and Clerical Workers (CPI-W).
From March 2021 to March 2022, real average hourly earnings for production and nonsupervisory employees decreased 2.4 percent, seasonally adjusted.
Here’s the March wage growth vs inflation chart. Just when you think it can’t get worse, it does. A new ABC/Ipsos poll found that 69% of Americans disapprove of how Biden is handling inflation. No surprise there. It’s bad. pic.twitter.com/jeWLvuIGnK
— Andy Puzder (@AndyPuzder) April 12, 2022
Author: Mario Lotmore


