A new study has revealed the states where you’re most likely to get your car stolen, with Colorado topping the list.
The study, conducted by personal injury and maritime law firm Scott Vicknair, analyzed data from the Federal Bureau of Investigation from 2012 to 2022. The ranking was then determined by the states with the highest thefts per 100,000 vehicles.


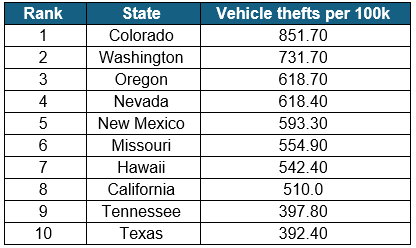
The study names Colorado as the state where you’re most likely to get your car stolen, with 851.70 reported thefts per 100,000 vehicles. According to the study, 45,883 vehicles were stolen between 2012 and 2022.
In second place is Washington, with 731.70 thefts per 100,000 registered vehicles. 49,777 vehicles were stolen in Washington between 2012 and 2022, making it one of the most prominent hot spots for car thefts in the US.

Oregon is in third place, with 618.70 thefts per 100,000 vehicles. In Oregon, 23,386 vehicles were stolen between 2012 and 2022.


Next up is Nevada, with 618.40 reported thefts per 100,000 registered vehicles. 15,588 vehicles were stolen in Nevada between 2012 and 2022.
New Mexico is in fifth place, with 593.30 thefts per 100,000 vehicles from 2012 to 2022. Over the decade, 11,448 gasoline vehicles were stolen in New Mexico.
In sixth place is Missouri, with 554.90 thefts per 100,000 registered vehicles. Between 2012 and 2022, 30,091 vehicles were stolen in Missouri.
Next on the list is Hawaii, with 542.40 thefts per 100,000 vehicles. In Hawaii, 5,861 vehicles were reported as stolen between 2012 and 2022.
California ranks eighth, with 510 thefts per 100,000 registered vehicles. 184,195 vehicles were stolen in California between 2012 and 2022.
Next up is Tennessee, with 397.80 thefts per 100,000 vehicles. In Tennessee, 25,550 vehicles were stolen between 2012 and 2022.
Lastly, Texas is in tenth place, with 392.40 thefts per 100,000 registered vehicles. In Texas, 99,450 vehicles were stolen between 2012 and 2022.
Overall, the study found that a staggering 938,295 registered vehicles were stolen in the US between 2012 and 2022.
Interestingly, the study named New Hampshire as the state where you’re least likely to get your car stolen, with just 67.60 thefts per 100,000 registered vehicles. Between 2012 and 2022, only 928 vehicles were reported as stolen in New Hampshire.
David Vicknair, a spokesperson for Scott Vicknair, commented on the study’s findings: “It’s astonishing to observe the number of vehicles that have been stolen in recent years. Car theft is a huge concern in the US, so this study helps highlight the states most at risk.
“This research should also highlight the significance of taking precautions to protect your car from theft. It’s always crucial to lock your car and ensure that your keys are stored in a safe place. It can also be worth installing extra precautions, such as steering wheel or tire locks. Hopefully, in the future, we will see the number of car thefts decrease, but for now, it’s clear that this is a still prevalent issue.”
This information was provided by personal injury and maritime law firm Scott Vicknair.
Rank State Vehicle thefts per 100k 1 Colorado 851.70 2 Washington 731.70 3 Oregon 618.70 4 Nevada 618.40 5 New Mexico 593.30 6 Missouri 554.90 7 Hawaii 542.40 8 California 510 9 Tennessee 397.80 10 Texas 392.40 11 Louisiana 375.60 12 Illinois 353 13 Minnesota 325.70 14 Alaska 320.40 15 Michigan 317.50 16 Oklahoma 297 17 Arkansas 284.40 18 Nebraska 278.90 19 Arizona 276.90 20 Wisconsin 269.30 21 Ohio 268.20 22 Maryland 267.40 23 South Carolina 266.30 24 Kansas 259.60 25 North Dakota 253.60 26 Montana 250 27 Kentucky 243.20 28 Connecticut 240.60 29 New York 238.50 30 North Carolina 237.80 31 Georgia 236.10 32 Utah 235 33 South Dakota 233.20 34 Indiana 223.60 35 Alabama 214.10 36 Pennsylvania 208.10 37 New Jersey 206.80 38 Rhode Island 200.20 39 Delaware 189.40 40 Mississippi 188 41 Virginia 182.60 42 Florida 169.30 43 Iowa 151.30 44 Wyoming 146.50 45 Massachusetts 128.40 46 West Virginia 105.70 47 Vermont 101.70 48 Idaho 91.40 49 Maine 80.40 50 New Hampshire 67.60
Methodology
- For each state, data was obtained from the Federal Bureau of Investigation’s crime data explorer from 2012 to 2022.
- To allow for accurate comparison between states, the figures were measured against 100,000 vehicles. This allowed for precise comparison across locations of differing sizes.
- The ranking was then determined by the states with the highest number of vehicle thefts per 100,000 vehicles.
SOURCE: Scottvicknair.com

Author: Lynnwood Times Staff