A new study by Dallas-based legal team The Barber Law Firm reveals that State Route-99 is the deadliest of routes in Washington.
The study analyzed the National Highway Traffic Safety Administration’s (NHTSA) Fatality Analysis Reporting System (FARS) data from 2018 to 2022 to determine which state routes had the highest average yearly fatalities and are thus the deadliest routes.
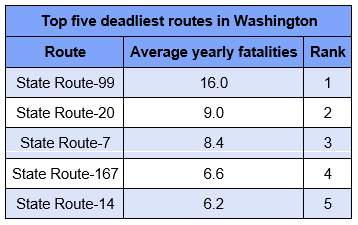
The route with the most deaths was State Route-99, which saw an average of 16.0 fatalities per year over the five-year period that was measured. In total, there were 80 deaths recorded on the route in the time period, from 76 fatal crashes, and the worst year for fatalities was 2022, when 20 deaths occurred.
State Route-20 comes in second place with an average of 9.0 fatalities. Between 2018 and 2022, there were 43 fatal crashes, which resulted in 45 deaths. 2020 was the worst year when 15 crashes resulted in 15 deaths.


In third place is State Route-7, where there has been an average of 8.4 fatalities between 2018 and 2022. With 13 fatalities caused by 13 accidents, 2022 was the deadliest year. Further down on the list, State Route-167 takes fourth place with 6.6 average yearly fatalities, while State Route-14 closes the top five with 6.2 average deaths.
Kris Barber, founder of The Barber Law Firm, commented on the findings: “The data shows that in all states, certain routes must be approached with more caution than others. Be it because of more intense traffic or the configuration of the road, this data can be a warning and a starting point for drivers to pay more attention.


“To stay safe while on the road, remember to keep focus only on driving and always keep your speed within the limits, as speeding gives you less time to react and increases the severity of an accident. Lastly, be extra careful when doing tasks that might seem basic such as changing lanes. Cutting in front of someone, changing too fast, or not using your signals may cause an accident or incite road rage.”
The full table of deadliest routes in the United States:
State Route Average Yearly Fatalities 1st 2nd 3rd 4th 5th 1st 2nd 3rd 4th 5th Alabama SR-69 SR-21 SR-1 SR-2 SR-3 14.40 9.60 8.80 8.40 8.00 Alaska SR-1 SR-3 13.80 10.00 Arizona SR-87 SR-101 SR-260 SR-202 SR-95 20.80 19.80 13.20 12.20 11.20 Arkansas SR-7 SR-5 SR-1 SR-18 SR-25 11.20 9.80 8.00 6.20 6.00 California SR-99 SR-1 SR-91 SR-60 SR-4 89.00 57.60 29.00 28.40 25.80 Colorado SR-83 SR-121 SR-96 SR-30 SR-119 9.00 5.80 5.80 5.20 5.00 Connecticut SR-8 SR-15 SR-10 SR-2 SR-34 10.80 8.40 8.00 3.80 3.60 Delaware SR-1 SR-4 SR-9 SR-7 SR-24 13.20 2.60 2.60 2.40 2.00 Florida SR-60 SR-91 SR-50 SR-70 SR-44 41.80 35.40 29.40 22.00 21.20 Georgia SR-3 SR-1 SR-11 SR-20 SR-10 22.00 18.40 15.00 13.20 12.40 Hawaii SR-11 SR-93 SR-83 SR-19 SR-92 6.40 5.20 5.00 5.00 4.20 Idaho SR-55 SR-75 SR-21 SR-33 SR-16 8.20 4.20 3.40 2.80 2.20 Illinois SR-83 SR-1 SR-50 SR-3 SR-43 15.80 13.60 12.20 11.40 7.80 Indiana SR-37 SR-67 SR-3 SR-135 SR-62 8.40 7.40 5.60 4.20 4.00 Iowa SR-2 SR-92 SR-3 SR-14 SR-163 4.00 3.20 3.20 3.00 2.80 Kansas SR-15 SR-4 SR-32 SR-156 SR-7 5.00 3.80 3.00 2.80 2.60 Kentucky SR-15 SR-9 SR-11 SR-1934 SR-7 9.40 5.80 5.60 4.00 3.80 Louisiana SR-1 SR-182 SR-308 SR-16 SR-10 18.60 10.40 8.80 7.80 7.40 Maine SR-4 SR-9 SR-11 SR-26 SR-15 6.40 4.60 3.20 2.60 2.20 Maryland SR-5 SR-295 SR-4 SR-2 SR-214 12.20 11.20 7.60 7.60 6.80 Massachusetts SR-28 SR-24 SR-2 SR-9 SR-140 8.00 5.60 5.40 4.80 3.80 Michigan SR-3 SR-102 SR-96 SR-46 SR-53 11.80 9.20 8.20 8.00 7.60 Minnesota SR-65 SR-23 SR-55 SR-210 SR-371 6.80 6.20 6.00 5.20 4.00 Mississippi SR-15 SR-25 SR-16 SR-35 SR-18 12.00 9.60 9.40 8.60 7.40 Missouri SR-5 SR-13 SR-30 SR-47 SR-7 11.00 10.20 8.80 8.20 7.40 Montana SR-200 4.40 Nebraska SR-64 SR-2 SR-92 SR-50 SR-15 3.80 3.40 3.20 2.80 2.60 Nevada SR-582 SR-159 SR-592 SR-160 SR-604 5.40 5.20 5.00 4.40 4.20 New Hampshire SR-11 SR-16 SR-28 SR-101 SR-125 4.40 4.40 3.80 3.80 3.20 New Jersey SR-27 SR-70 SR-35 SR-55 SR-47 8.40 8.00 7.00 6.80 6.40 New Mexico SR-45 SR-128 SR-68 SR-18 SR-14 10.40 6.20 5.60 4.00 3.80 New York SR-27 SR-25 SR-5 SR-31 SR-104 16.60 15.60 12.80 8.80 8.00 North Carolina SR-24 SR-87 SR-55 SR-11 SR-16 19.60 13.40 11.40 10.40 10.20 Ohio SR-7 SR-4 SR-2 SR-3 SR-73 10.00 9.60 7.20 6.80 6.60 Oklahoma SR-51 SR-3 SR-66 SR-9 SR-33 11.80 10.20 8.80 8.80 6.80 Oregon SR-99 SR-22 SR-126 SR-18 SR-140 13.80 7.80 7.80 6.60 5.40 Pennsylvania SR-611 SR-309 SR-51 SR-8 SR-61 13.00 7.60 5.80 5.60 5.40 Rhode Island SR-117 2.60 South Carolina SR-9 SR-6 SR-34 SR-20 SR-41 14.80 11.60 11.60 8.20 8.00 South Dakota SR-44 SR-37 SR-34 SR-79 3.60 3.20 3.00 2.60 Tennessee SR-175 SR-1 SR-14 SR-62 SR-45 12.80 11.20 11.00 7.20 6.80 Texas SR-6 SR-71 SR-16 SR-12 SR-105 31.40 23.20 19.60 18.80 17.00 Utah SR-68 SR-126 SR-201 SR-154 SR-18 8.00 4.20 3.80 3.20 3.00 Vermont SR-105 SR-100 SR-15 4.40 3.40 2.80 Virginia SR-3 SR-10 SR-40 SR-143 SR-7 8.80 6.80 6.00 5.20 4.60 Washington SR-99 SR-20 SR-7 SR-167 SR-14 16.00 9.00 8.40 6.60 6.20 West Virginia SR-2 SR-16 SR-10 SR-20 SR-14 7.00 6.40 5.80 4.20 3.00 Wisconsin SR-35 SR-32 SR-33 SR-29 SR-11 10.80 8.00 6.80 6.00 5.80 Wyoming SR-59 3.20
SOURCE: https://www.thebarberlawfirm.com/.

Author: Lynnwood Times Staff