On September 10, OSPI released its K-12 Report Card for the 2023-24 school year. Following national trends, fewer than half of Washington students met academic proficiency. Testing was over grades 3-8 and 10.
In Washington state, only 50.3% of students met ELA standards, 39.7% met math standards, and 43.5% met science standards in their spring 2023 assessments, according to the OSPI report card. The state has not seen a significant change in scores in the last three years.


“We often see the results of these tests being miscommunicated to mean something that they don’t,” State Superintendent Chris Reykdal released in a statement. “The state tests are not Pass/Fail and students who do not meet the college readiness proficiency standard are not necessarily below grade level in their knowledge. On the tests, students demonstrate their grade-level knowledge and skills along a continuum of complexity.”
Federal law requires each state to administer statewide testing in grades 3–8 and once in high school. Last spring, nearly 95% of Washington students in grades 3-8 and 10 took the state assessments.


The statewide assessments are provided by Smarter Balanced, a California-based assessment system that relies on thousands of educators to write and review test questions to align with each state’s academic standards.
In the Smarter Balanced system, students are placed into one of four levels of achievement: novice, developing, proficient, and advanced. In previous years, students who placed within the third and fourth levels (proficient and advanced) were counted as those meeting the state’s academic standards.
In 2024, Smarter Balanced clarified that levels two, three, and four (developing, proficient, and advanced) are considered “grade level.” Smarter Balanced explained that level two can now be described as “nearly meets” grade level while level three “meets” grade level.
More information about the Smarter Balanced assessment scoring can be found on the Smarter Balanced website.
In previous years, OSPI only included student assessment data that indicated proficiency and above, which they described as “students on track for college-level learning without needing remedial classes.” This year, OSPI has included a second set of data which includes levels two, three, and four, which is described as “students showing foundational grade level knowledge and skills or above.”
In other words, OSPI now includes students who “nearly meet” grade level in their assessment data, which results in higher percentages.
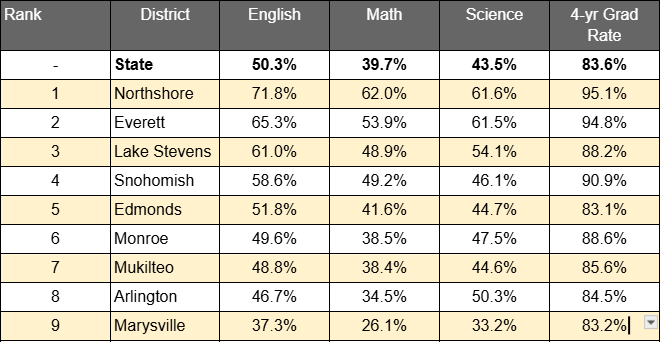
Snohomish County Assessment Data for school year 2023-24
For the purposes of clarity and consistency, the Lynnwood Times has compiled student assessment data based on the number of students who meet proficiency or above, as was done in previous years.
The Lynnwood Times has compiled data on the nine most populous school districts in Snohomish County to help its readership understand how their district compares with others.
Northshore School District
Of its 23,227 students, 71.8% met ELA standards, 62.0% met math standards, and 61.6% met science standards at grade level or above.
The district saw a 1% increase in ELA, math, and science from the previous year. Northshore has an average class size of 18 students.
Everett School District
Of its 20,437 students, 65.3% met ELA standards, 53.9% met math standards, and 61.5% met science standards at grade level or above.
The district saw a 2% increase in math and a 5% increase in science from the previous year. There was no significant change in ELA scores. Everett has an average class size of 17 students.
Lake Stevens
Of its 9,870 students, 61% met ELA standards, 48.9% met math standards, and 54.1% met science standards at grade level or above.
The district saw a 1% decrease in all subjects from the previous year. Lake Stevens has an average class size of 21 students.
Snohomish School District
Of its 9,642 students, 58.6% met ELA standards, 49.2% met math standards, and 46.1% met science standards at grade level or above.
The district did not see a significant academic change from the previous year. Snohomish has an average class size of 19 students.
Edmonds School District
Of its 20,807 students, 51.8% met ELA standards, 41.6% met math standards, and 44.7% met science standards at grade level or above.
The district saw a 2% decrease in ELA scores, and a 1% decrease in science scores. In 2023 Edmonds had an average class size of 19 students.
Monroe School District
Of its 5,693 students, 49.6% met ELA standards, 38.5% met math standards, and 47.5% met science standards at grade level or above.
The district saw a 1% decrease in math scores and a 5% increase in science scores. In 2023 Monroe had an average class size of 18 students.
Mukilteo School District
Of its 15,279 students, 48.8% met ELA standards, 38.4% met math standards, and 44.6% met science standards at grade level or above.
The district saw a 1% decrease in math scores and a 1% increase in science scores. In 2023 Mukilteo had an average class size of 16 students.
Arlington School District
Of its 5,653 students, 46.7% met ELA standards, 34.5% met math standards, and 50.3% met science standards at grade level or above.
The district saw a 5.7% decrease in ELA scores and a 2% increase in science scores. In 2023 Arlington had an average class size of 16 students.
Marysville School District
Of its 10,015 students, 37.3% met ELA standards, 26.1% met math standards, and 33.2% met science standards at grade level or above.
The district saw a 1% increase in ELA scores and a 2% increase in math scores. In 2023 Marysville had an average class size of 18 students.
Enrollment
In 2023-24, enrollment has steadily decreased over the last six years, and currently only 1,100,059 students are enrolled in Washington public schools. Since the 2017-18 school year, enrollment has dropped by 30,655 students, despite Washington’s population increasing by 28,403 in 2023, according to the Census Bureau.
One explanation for this drop is that parents and students are pursuing different routes—homeschooling or private schools.
Though there has been a decline in homeschooling since its spike at 40,000 students in 2020, homeschooling still pulls tens of thousands of Washington students from public school enrollment.
And according to research by Stanford University economist Thomas Dee, Washington private school enrollment increased 26% between 2019-20 and 2022-23, one of the largest flights to private schools of any state in the country.
Another explanation, as evidenced by Associated Press findings, is that many students are simply unaccounted for. According to the AP, homeschooling and private schooling account for only two-thirds of the students who have left public schools since fall of 2019.
The missing third may be a result of truancy, homelessness, unregistered homeschooling, and opting out of kindergarten.

Author: Olivia Thiessen


3 Responses
Way to go Democrats.. Dems run the education/indoctrination system.
Still performing WELL above “Red States!”
These class sizes are preposterously and incorrectly low. I’m genuinely interested in how they calculated that. # of students/building divided by staff per building would not tell you class size. Everett High Schools regularly have 28-31 students in a core content class.