Article Summary
- Washington housing construction rebounded in the third quarter of 2021.
- Seattle-area consumer price inflation outpaced the national average in the year ending in October 2021.
- Major General Fund-State (GF-S) revenue collections for the October 11 – November 10, 2021 collection period came in $139.6 million (6.5%) higher than forecasted in September.
- Cumulatively, collections are now $292.2 million (7.3%) higher than forecasted.
OLYMPIA, Wash., November 27, 2021 – Washington’s unemployment rate declined to 5.0% in October from a revised 5.1% in September. The unemployment rate is down significantly from the 16.3% rate reached in April 2020 which was an all-time high in the series that dates back to 1976. At the business cycle peak in February 2020 the Washington unemployment rate was 4.1%.
There is two months of new Washington employment data since the September forecast was released. Total seasonally adjusted nonfarm payroll employment increased 23,100 in September and October which was 2,300 less than the increase of 25,400 expected in the forecast. Washington employment is now 101,500 (2.9%) lower than at its February 2020 peak. Private services-providing sectors added 25,300 jobs in September and October. The manufacturing sector added 2,300 jobs including 700 jobs in aerospace manufacturing. Construction employment increased by 2,600 jobs in the two-month period. State and local government employment decreased by 7,700 jobs in September and October but the federal government added 600 jobs.


Washington housing construction rebounded in the third quarter of 2021 on a surge in multifamily activity. The number of housing units authorized by building permits rose to 56,100 (SAAR) in the third quarter from 47,600 in the second quarter. Third quarter permits consisted of 23,200 single-family units, down from 24,300 in the second quarter, and 32,900 multi-family units, up from 23,300. The September forecast expected 53,400 units (SAAR) in the third quarter, consisting of 24,700 single-family units and 28,700 multi-family units.
Seattle-area home prices continue to rise rapidly but appreciation may be slowing. According to the S&P/Case-Shiller Home Price Indices, seasonally adjusted Seattle home prices increased 1.1% in August compared to a 1.2% increase in the composite-20 index. While still quite high, the rate of appreciation in the Seattle market has declined in each of the last five months. August Seattle home prices were up 24.4% over the year, down slightly from a record 25.5% over-the-year increase in July. In comparison, the composite-20 index was up 19.7% over the year. August Seattle home prices were up 158% since the December 2011 trough and exceeded the May 2007 peak by 79%.


According to the World Institute for Strategic Economic Research (WISER), Washington exports increased 23% from the third quarter of 2020 to the third quarter of 2021. After more than two years of year-over-year declines, Washington exports of transportation equipment (mostly Boeing planes) increased for a second consecutive quarter, rising 60% over the year. Agricultural exports decreased 10% over the year but this could be misleading as the data include soybean and corn exports which receive only minimal processing in Washington. Exports from all other sectors (mostly manufacturing) increased 26% over the year.


Seattle-area consumer price inflation outpaced the national average in the year ending in October 2021. From October 2020 to October 2021, the seasonally adjusted Seattle CPI rose 6.5% compared to the 6.2% increase in the U.S. City Average index. These relatively high rates were partially due to much higher food and energy prices this year compared to last year. However, core prices, which exclude food and energy, still increased 5.2% in Seattle and 4.6% in the national index. Seattle shelter cost inflation trailed the national average at 2.6% compared to 3.5%. Seattle inflation excluding shelter exceeded the national average at 8.7% compared to 7.6%.
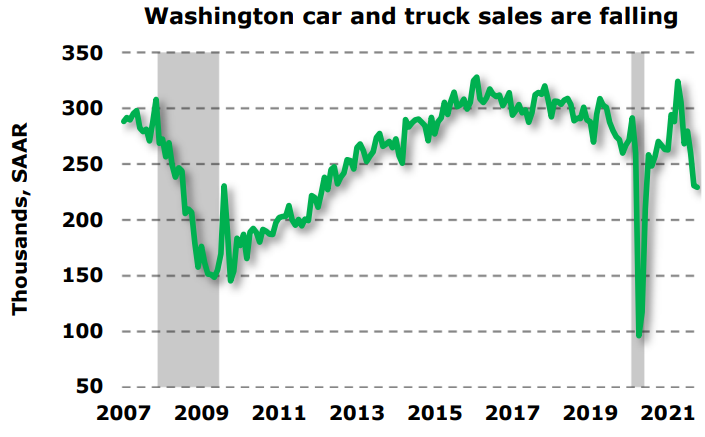
Washington car and truck sales declined for a third consecutive month in October. The seasonally adjusted number of new vehicle registrations fell 0.7% in October following declines of 7.1% and 11.3% in August and September. The number of registrations is down 15.2% over the year and is now at its lowest level since June 2020 (see figure).
Revenue
Overview
Major General Fund-State (GF-S) revenue collections for the October 11 – November 10, 2021 collection period came in $139.6 million (6.5%) higher than forecasted in September. Cumulatively, collections are now $292.2 million (7.3%) higher than forecasted.
Revenue Act
Revenue Act taxes consist of the sales, use, business and occupation (B&O), utility, and tobacco products taxes along with associated penalty and interest payments. The revenue collections reported here are for the October 11 – November 10, 2021 collection period. Collections correspond primarily to the September 2021 economic activity of monthly filers and third quarter 2021 activity of quarterly filers.
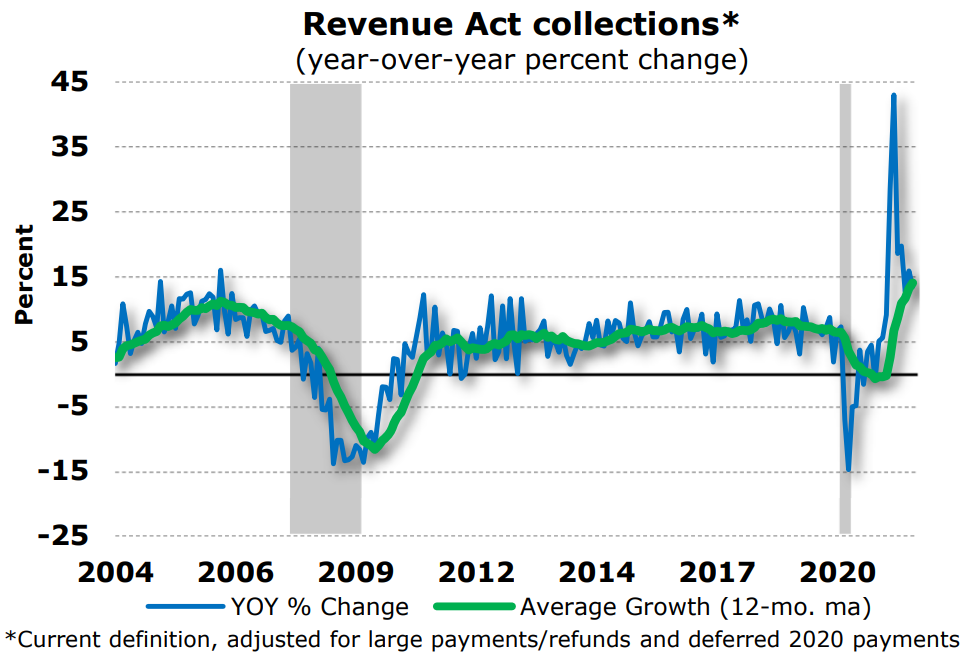
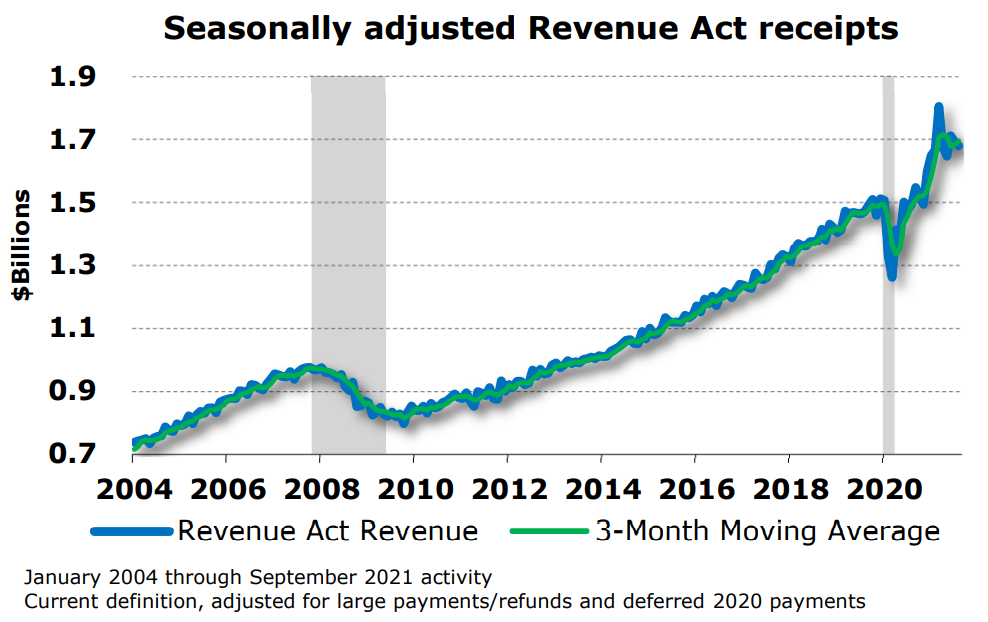
Revenue Act collections for the current period came in $86.8 million (4.9%) higher than the September forecast. Adjusted for large one-time payments and refunds, collections increased 13.4% year over year (see figure). The 12-month moving average of year-over-year growth increased to 13.9%. Seasonally adjusted collections decreased slightly from last month’s level (see figure). Adjusted revenue representing third quarter 2021 activity (August 11 – November 10 collections) increased 13.9% year over year after increasing 26.0% for second quarter activity. Cumulatively, collections are now $166.6 million (4.9%) higher than forecasted.
As shown in the “Key Revenue Variables” table, unadjusted Revenue Act collections increased 14.2% year over year. Retail sales tax collections increased 14.7% year over year and B&O tax collections increased 13.8% year over year.
Total tax payments as of October 29 from electronic filers who also filed returns for September activity in the October 11 – November 10, 2020 period were up 11.6% year over year (payments are mainly Revenue Act taxes but include some non-Revenue Act taxes as well). Last month payments were up 11.7% year over year. Some details of the payments:
Total payments in the retail trade sector increased 7.3% year over year. Last month, payments increased 6.9% year over year.
Payments from the motor vehicles and parts sector increased 6.8% year over year. Last month, payments in the sector increased 2.7% year over year.
Retail trade sectors showing the highest growth rates were: apparel and accessories (+32.7%), furniture and home furnishings (+15.7%), gas stations and convenience stores (+15.1%), miscellaneous retailers (+8.4%) and sporting goods, toys, books and music (+8.0%). One sector, electronics and appliances, showed negative growth (-1.5%) due to high payments last year.
Payments from non-retail trade sectors increased 14.1% year over year in the current period. Last month, year-over-year payments increased 14.7%.
Tax payments by businesses in the accommodation and food services sector were up 40.1% year over year. Last month receipts from the sector were up 49.5% year over year.
Payments from the manufacturing sector increased by 19.0% year over year. Last month payments increased 13.1% year over year. This month saw large increases in payments from both the petroleum refining and transportation equipment sectors. Excluding the transportation and petroleum sectors, payments from the remaining manufacturing sectors increased by 8.9% year over year after increasing 20.0% last month.
Tax payments by businesses in the construction sector increased 11.5% year over year. Last month receipts from the construction sector increased 12.7% year over year.
DOR Non-Revenue Act
October DOR non-Revenue Act collections came in $53.7 million (13.3%) higher than forecasted. Cumulatively, collections are now $126.7 million (19.9%) higher than forecasted.
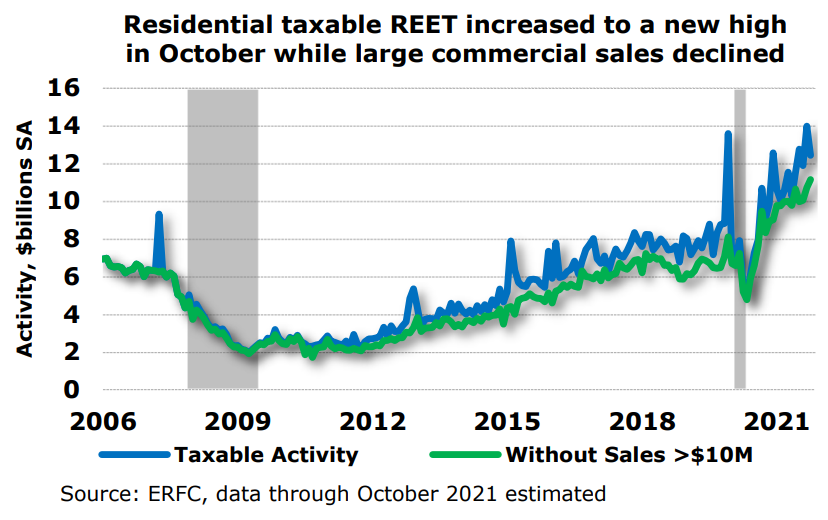
The largest contributor to this month’s surplus was once again real estate excise tax (REET), which came in $43.4 million (34.4%) higher than forecasted. Seasonally adjusted taxable activity decreased from last month’s record high (see figure). Sales of large commercial property (property valued at $10 million or more) decreased to a still strong $1.28 billion from last month’s revised total of $3.27 billion while seasonally adjusted activity excluding large sales increased to a record high for that category. Cumulatively, collections are now $112.5 million (42.9%) higher than forecasted.
Net transfers of unclaimed property into the GF-S were $13.4 million (11.4%) higher than forecasted. October sees a large volume of transfers because businesses are required to submit unclaimed property in their possession to the state annually by October 31. Cumulatively, net transfers are now $16.9 million (14.4%) higher than forecasted.
Property tax collections came in $0.5 million (0.6%) higher than forecasted. Cumulatively, however, collections are now $3.3 million (2.8%) lower than forecasted.
Liquor taxes came in $2.0 million (7.3%) higher than forecasted. Cumulatively, collections are now $4.8 million (9.2%) higher than forecasted.
Cigarette tax receipts came in $5.5 million (21.2%) lower than forecasted. Cumulatively, receipts are now $5.6 million (9.5%) lower than forecasted.
All other DOR revenue came in $0.1 million (0.4%) lower than forecasted. Cumulatively, however, this revenue is now $1.5 million (5.2%) higher than forecasted.
Other Revenue
The GF-S share of fines, fees, surcharges, and forfeitures from the Washington court system was $0.9 million (20.9%) lower than forecasted. Cumulatively, receipts are now $1.1 million (13.6%) lower than forecasted.
To view the full report from the Economic and Revenue Forecast Council click here.
Content Source: Economic and Revenue Forecast Council Press Release

Author: Lynnwood Times Staff