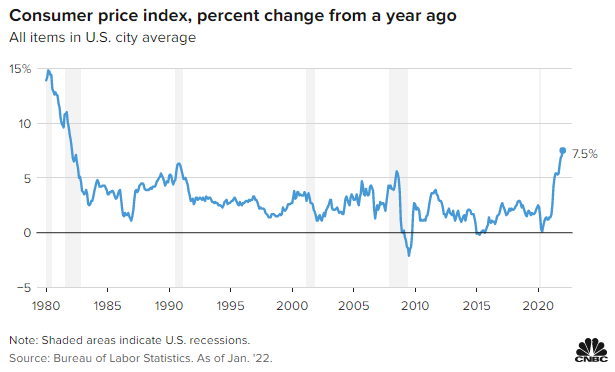
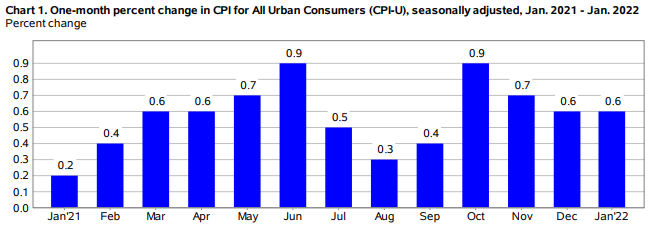
The Consumer Price Index for All Urban Consumers (CPI-U) increased 0.6 percent in January 2022 on a seasonally adjusted basis, the U.S. Bureau of Labor Statistics reported today. Over the last 12 months, the all items index (core inflation) increased 7.5 percent for January 2022 before seasonal adjustment, well above the 7.2 percent expected year-over-year inflation.
Increases in the indexes for food, electricity, and shelter were the largest contributors to the seasonally adjusted all items increase. The food index rose 0.9 percent in January following a 0.5-percent increase in December, an 80 percent increase in one month. The energy index also increased 0.9 percent over the month, with an increase in the electricity index being partially offset by declines in the gasoline index and the natural gas index.


Core inflation, the index for all items less food and energy rose 0.6 percent in January, the same increase as in December. This was the seventh time in the last 10 months it has increased at least 0.5 percent. Along with the index for shelter, the indexes for household furnishings and operations, used cars and trucks, medical care, and apparel were among many indexes that increased over the month.
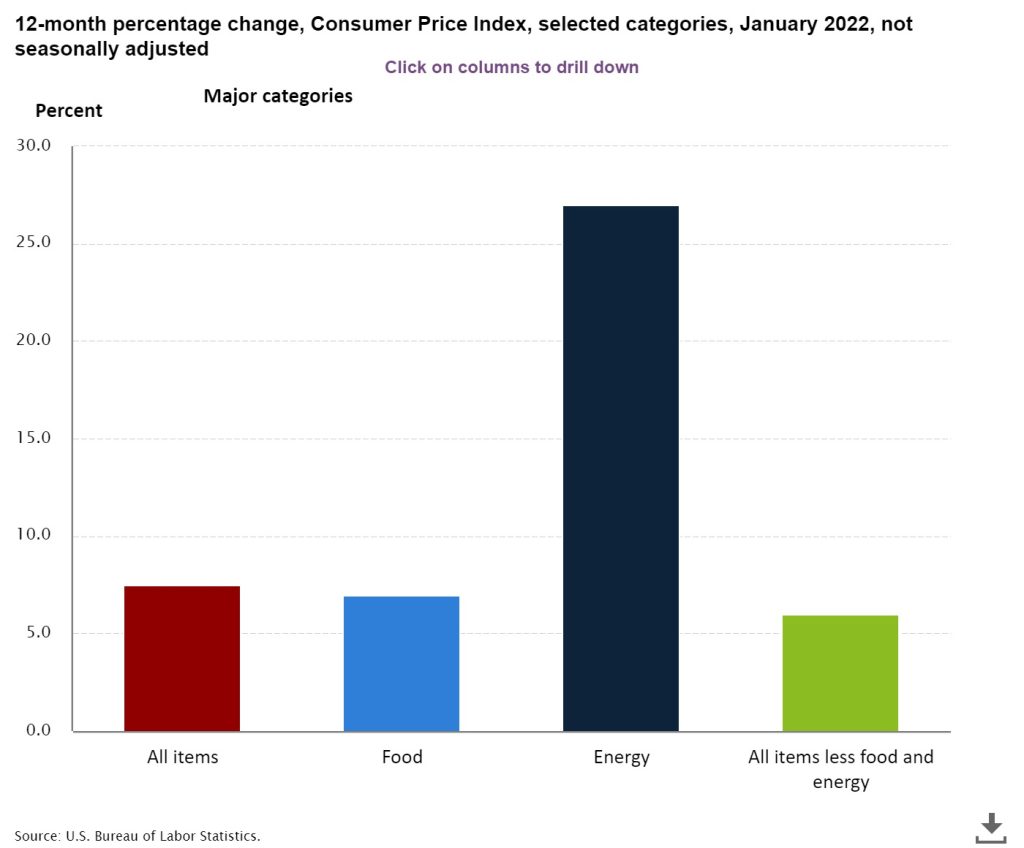
The all items index rose 7.5 percent for the 12 months ending January, the largest 12-month increase since the period ending February 1982. The all items less food and energy index rose 6.0 percent, the largest 12-month change since the period ending August 1982. The energy index rose 27.0 percent over the last year, and the food index increased 7.0 percent.

To view BLS inflation for December 2021, click here.


Inflation Calculations
The CPI-U (consumer price index) is the broadest measure of consumer price inflation for goods and services published by the Bureau of Labor Statistics (BLS). It measures the change in prices paid by consumers for goods and services. The methodologies in calculating inflation have shifted over the years – once in 1980s and the other in 1990s. These changes in calculations have depressed reported core inflation now used by BLS.
In the chart below, ShadowStats.com, offers alternatives to government economic statistics for the United States, shows SGS-Alternate CPI estimates based on the methodology which was employed prior to 1980. Many economists argue that this provides an apples-to-apples comparison to core inflation currently calculated by BLS.
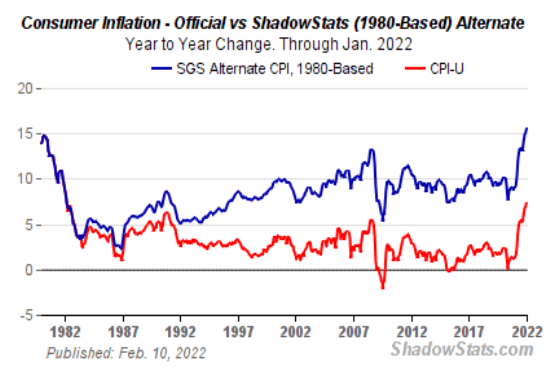
According to ShadowStats.com, actual inflation based on the 1980 calculation would be “15.63% [up from 15.15% in December], the steepest inflation rate since June 1947 (in 75 years).“
The Food Index
The food index increased 0.9 percent in January. The index for cereals and bakery products increased the most, rising 1.8 percent over the month. The index for other food at home increased 1.6 percent in January, while the index for dairy and related products rose 1.1 percent. The fruits and vegetables index rose 0.9 percent over the month, and the meats, poultry, fish, and eggs index increased 0.3 percent. The only grocery store group index not to increase in January was the index for nonalcoholic beverages, which was unchanged.
The food at home index rose 7.4 percent over the last 12 months. All of the six major grocery store food group indexes increased over the period. By far the largest increase was that of the index for meats, poultry, fish, and eggs, which rose 12.2 percent over the year. The index for dairy and related products increased 3.1 percent, the smallest 12-month increase among the groups.
The Energy Index
The energy index increased 0.9 percent in January. The electricity index rose sharply in January, increasing 4.2 percent. The gasoline index fell 0.8 percent in January after rising rapidly in the autumn of 2021. (Before seasonal adjustment, gasoline prices rose 0.1 percent in January.) The index for natural gas also declined in January, falling 0.5 percent after declining 0.3 percent in December.
The energy index rose 27.0 percent over the past 12 months with all major energy component indexes increasing. The gasoline index rose 40.0 percent over the last year, despite declining in January. The index for natural gas rose 23.9 percent over the last 12 months, and the index for electricity rose 10.7 percent.

Author: Mario Lotmore