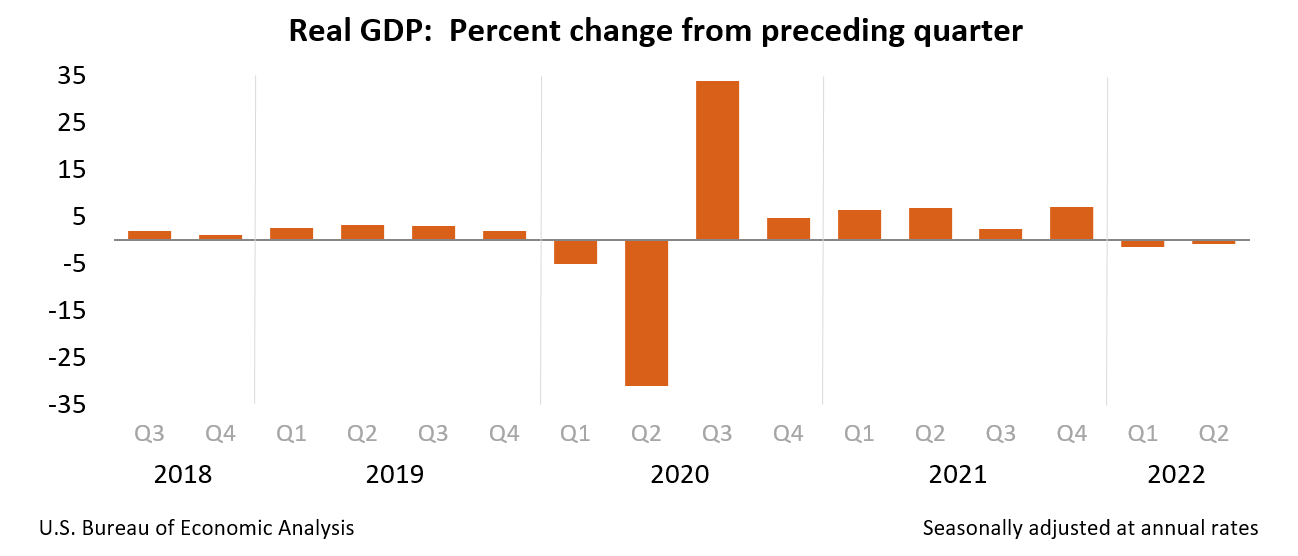
WASHINGTON, D.C., July 28, 2022 — Today the Department of Commerce’s Bureau of Economic Analysis (BEA) announced real gross domestic product (GDP) decreased at an annual rate of 0.9 percent in the second quarter of 2022. In the first quarter, real GDP decreased 1.6 percent.
Treasury Secretary Janet Yellen in a recent appearance on NBC’s Meet the Press on Sunday downplayed U.S. recession risk stating that while two consecutive quarters of negative growth is generally considered a recession, conditions in the economy are unique.
After historic economic growth – regaining all private sector jobs lost during the pandemic – we knew the economy would slow down as the Fed acts on inflation.
Our job market is strong, spending is up, and unemployment is down. We have the resilience to weather the transition.
— President Biden (@POTUS) July 28, 2022
The Federal Open Market Committee raised the target range for the federal funds rate by 3/4 percentage point, bringing the target range to 2-1/4 to 2-1/2 percent, Federal Reserve Chairman Jerome Powell announced yesterday. The explanation for such an aggressive rate hike according to Federal Reserve Chair Powell, is “to take the measures necessary to return inflation to our 2 percent longer-run goal.”
On July 13, the U.S. Bureau of Labor Statistics announced that consumer inflation rose to a 41-year high of 9.1% in June, up from 8.6% in May – the highest inflation since November of 1981. The energy index rose 41.6% over the last year, the highest since April 1980.
The decrease occurred amid increasing inflation, low unemployment, ongoing supply-chain challenges, and rising interest rates. The economic effects of these factors cannot be quantified in the GDP estimate for the second quarter of 2022 because the impacts are generally embedded in source data and cannot be separately identified.
The GDP estimate released today is based on source data that are incomplete or subject to further revision by the source agency. The “second” estimate for the second quarter, based on more complete data, will be released on August 25, 2022. Three months of source data were available for consumer spending on goods; shipments of capital equipment; motor vehicle sales and inventories; manufacturing, wholesale, and retail trade inventories; exports and imports of goods; federal government outlays; and consumer, producer, and international prices.

The decrease in real GDP reflected decreases in private inventory investment, residential fixed investment, federal government spending, state and local government spending, and nonresidential fixed investment that were partly offset by increases in exports and personal consumption expenditures (PCE). Imports, which are a subtraction in the calculation of GDP, increased.
The decrease in private inventory investment was led by a decrease in retail trade (mainly general merchandise stores as well as motor vehicle dealers). The decrease in residential fixed investment was led by a decrease in “other” structures (specifically brokers’ commissions). The decrease in federal government spending reflected a decrease in nondefense spending that was partly offset by an increase in defense spending.
The decrease in nondefense spending reflected the sale of crude oil from the Strategic Petroleum Reserve, which results in a corresponding decrease in consumption expenditures. Because the oil sold by the government enters private inventories, there is no direct net effect on GDP. The decrease in state and local government spending was led by a decrease in investment in structures. The decrease in nonresidential fixed investment reflected decreases in structures and equipment that were mostly offset by an increase in intellectual property products. The increase in imports reflected an increase in services (led by travel).

The increase in exports reflected increases in both goods (led by industrial supplies and materials) and services (led by travel). The increase in PCE reflected an increase in services (led by food services and accommodations as well as health care) that was partly offset by a decrease in goods (led by food and beverages).
Real GDP decreased less in the second quarter than in the first quarter, decreasing 0.9 percent after decreasing 1.6 percent. The smaller decrease reflected an upturn in exports and a smaller decrease in federal government spending that were partly offset by larger declines in private inventory investment and state and local government spending, a slowdown in PCE, and downturns in nonresidential fixed investment and residential fixed investment. Imports decelerated.
Current‑dollar GDP increased 7.8 percent at an annual rate, or $465.1 billion, in the second quarter to a level of $24.85 trillion. In the first quarter, GDP increased 6.6 percent, or $383.9 billion (tables 1 and 3).
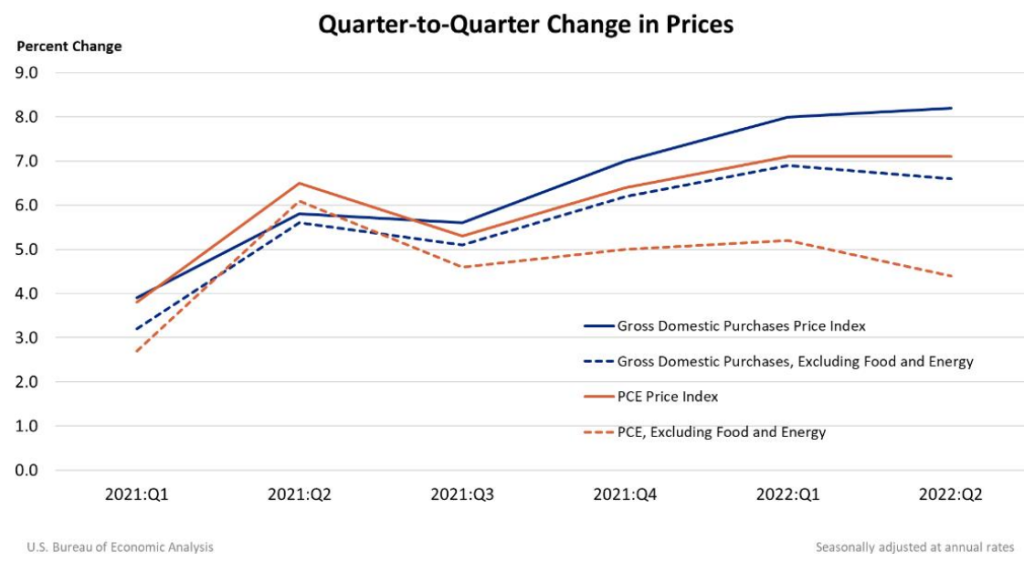
The price index for gross domestic purchases increased 8.2 percent in the second quarter, compared with an increase of 8.0 percent in the first quarter (table 4). The PCE price index increased 7.1 percent, the same rate as the first quarter. Excluding food and energy prices, the PCE price index increased 4.4 percent, compared with an increase of 5.2 percent.
Personal Income
Current-dollar personal income increased $353.8 billion in the second quarter, compared with an increase of $247.2 billion in the first quarter. The increase primarily reflected increases in compensation (led by private wages and salaries), proprietors’ income (both nonfarm and farm), personal income receipts on assets, and rental income.

Disposable personal income increased $291.4 billion, or 6.6 percent, in the second quarter, in contrast to a decrease of $58.8 billion, or 1.3 percent, in the first quarter. Real disposable personal income decreased 0.5 percent, compared with a decrease of 7.8 percent. Personal saving was $968.4 billion in the second quarter, compared with $1.02 trillion in the first quarter. The personal saving rate—personal saving as a percentage of disposable personal income—was 5.2 percent in the second quarter, compared with 5.6 percent in the first quarter.
Prices
Gross domestic purchases prices, the prices of goods and services purchased by U.S. residents, increased 8.2 percent in the second quarter after increasing 8.0 percent in the first quarter. Excluding food and energy, prices increased 6.6 percent after increasing 6.9 percent.

Personal consumption expenditure (PCE) prices increased 7.1 percent in the second quarter, the same rate as the first quarter. Excluding food and energy, the PCE “core” price index increased 4.4 after increasing 5.2 percent
Source Data for the Advance Estimate
Information on the source data and key assumptions used in the advance estimate is provided in a Technical Note that is posted with the news release on BEA’s website. A detailed “Key Source Data and Assumptions” file is also posted for each release. For information on updates to GDP, refer to the “Additional Information” section that follows.
Content Source: Bureau of Economic Analysis press release with additions by Mario Lotmore
Author: Lynnwood Times Staff


