


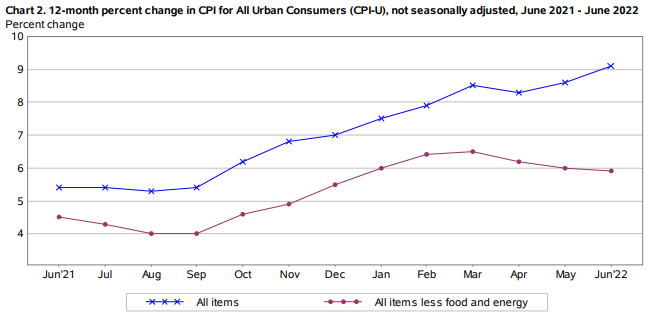
WASHINGTON D.C., July 13, 2022 – Today, the U.S. Bureau of Labor Statistics announced that consumer inflation rose to a 41-year high of 9.1% in June, up from 8.6% in May. The Consumer Price Index for All Urban Consumers (CPI-U) increased 1% from May to June.
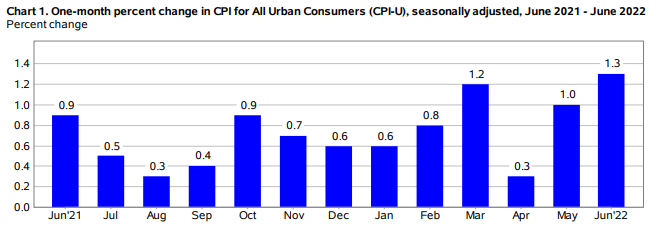
Americans have not experienced such high consumer inflation since November of 1981. The all items less food and energy index rose 5.9%, the largest 12-month change since the period ending April 1980. The energy index rose 41.6% over the last year, highest since April 1980.



The index for food at home rose 1.0% in June from May, the sixth consecutive increase of at least 1.0 percent in that index. Although the overall food index increased 10.4%, the largest 12-month increase since the period ending February 1981, the food at home index rose 12.2%, the largest 12-month increase since the period ending April 1979.
All six major grocery store food group indexes increased over the span, with five of the six rising more than 10%. The index for other food at home increased the most, rising 14.4%, with the index for butter and margarine increasing 26.3%. The remaining groups saw increases ranging from 8.1% (fruits and vegetables) to 13.8% (cereals and bakery products).




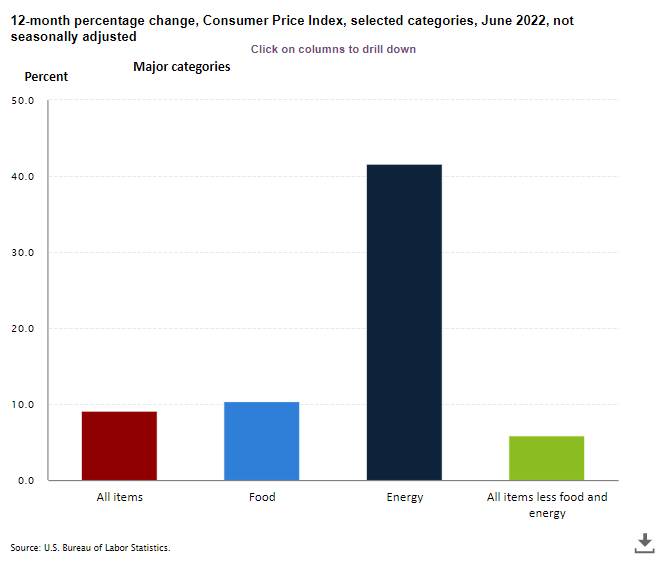
The energy index rose 41.6% over the past 12 months. The gasoline index increased 59.9% over the span, the largest 12-month increase in that index since March 1980. The index for electricity rose 13.7%, the largest 12-month increase since the period ending April 2006. The index for natural gas increased 38.4% over the last 12 months, the largest such increase since the period ending October 2005.

Increases in the indexes for gasoline, shelter and food round up the largest contributors to the increase. The indexes for motor vehicle repair, apparel, household furnishings and operations, and recreation also increased in June. Among the few major component indexes to decline in June were lodging away from home and airline fares.


The March 2022 CPI-W (used in Social Security Cost of Living Adjustment [COLA] calculations, hit a four-decade high of 9.8.
The Consumer Price Index for July 2022 is scheduled to be released on Wednesday, August 10, 2022.
Real Earnings – June 2022
Real average hourly earnings for all employees decreased 1% from May to June, seasonally adjusted, the U.S. Bureau of Labor Statistics reported. This result stems from an increase of 0.3% in average hourly earnings combined with an increase of 1.3% in the Consumer Price Index for All Urban Consumers (CPI-U).

Real average hourly earnings decreased 3.6%, seasonally adjusted, from June 2021 to June 2022.
Here June’s wage growth v inflation chart based on BLS data. Inflation soared, wage growth declined for a huge negative gap. The number on your paycheck got bigger. It’s just worth a lot less. Biden econ adviser – “This is about the future of the Liberal World Order.” Yes, it is. pic.twitter.com/MoBbS4n0rE
— Andy Puzder (@AndyPuzder) July 13, 2022
Real average hourly earnings for production and nonsupervisory employees decreased 1.1% from May to June, seasonally adjusted. This result stems from a 0.5-percent increase in average hourly earnings combined with an increase of 1.5 percent in the Consumer Price Index for Urban Wage Earners and Clerical Workers (CPI-W).
From June 2021 to June 2022, real average hourly earnings for production and nonsupervisory employees decreased 3.1 percent, seasonally adjusted.


Latest Seattle Area Economic Summary
The 12-month percent change in May 2022 Consumer Price Index for the Seattle-Tacoma-Bellevue area is 9.1% for all items compared to 8.3% for all other U.S. cities. Food was up 11.4%. Although energy was up 24.1% in the area, this is significantly lower than 30.3% for the rest of U.S. cities during the same period.

Author: Mario Lotmore



2 Responses
Jay Inslee represents experienced incompetency with a long history of poor fiscal responsibility and a pension for showing his middle finger to those who notice. With the unblushing blessing of this ‘news’ outlet and many more and without a trace of any quantifiable results or potential for results, his war on fossil fuels is ahead of technology, infrastructure and generation capacity. There is not a democrat on the planet who understands the >>right now<< gap between what approved power is available and what is actually needed to push out all gas us in commercial residential and transportation while also lobbying to remove 4 dams (to start). The utopian bliss our WA state democrats must live in to be absolved of any need to do the math or to do any kind of cost VS benefit considerations on the governors mandates I cannot even imagine. The fact is this, as Seattle votes out every reliable and affordable for of power known on the planet while causing shortfalls and greatly increasing cost of those resources the middle class either gets out while thy can or learns to embrace poverty. Literally and factually everything you can imagine, in the midst of inflation with a full on Bidenomics recession looming, they will drive the price/cost of everything that is manufactured, produced, harvested, transported, imported/exported, bought & sold to levels unheard of in our lifetimes and you can bet the farm on that one skippy. Open your eyes and look around, its already in full swing and we are just getting started with forced electrification. The one thing that could save us, modern distributed nuclear power, is off the table because democrats still believe that anything they plug into a wall outlet will magically deliver all the power they will ever need. If you don't have solar on your house right now, when your electric bill triples in the next 3 to 5 years you will regret that lack of planning ahead. Unfortunately democrats have a never ending supply of hall passes on their own dumpster fires and will never be held accountable. They will lower your quality of life down to basic subsistence while claiming they have saved the planet (A statement they cannot and are not required to prove or quantify) and you will reward them with your vote.
Excellent commentary! Unfortunately, it far beyond the understanding of most low information Bidenites.