SNOHOMISH COUNTY, July 25, 2022 – The first round of test scores since the pandemic is in for Snohomish County schools. Almost entirely across the board, fewer students met standards for English, Math, and Science, indicating how the last two years have affected public education. However, this decrease in the number of students that met standards is not unique to the County but is also a state and national issue.
Typically, the Washington Office of Superintendent of Public Instruction (OSPI) provides academic achievement updates for Washington public school districts annually. The OSPI measures student achievement based on the number of students who meet Washington’s academic standards and then reports those metrics via the K12 Report Card page on the Office’s website.


However, as the response to the global pandemic changed the landscape of public education, the OSPI hasn’t updated its K12 Report Card since the 2018-19 school year—until now. Earlier this year, the OSPI shared Fall 2021 test scores from each district. All nine school districts that the Lynnwood Times examined in the County reported fewer students meeting standards in the three main subject areas. The most dramatic decline was seen in Math assessment scores, with multiple school districts reporting a drop of 20 points or greater in the subject.
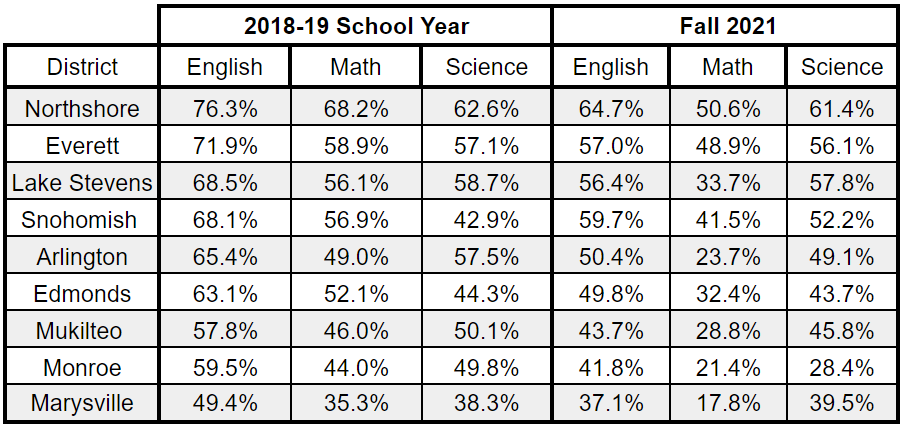
The charts below detail student academic achievement before and after the pandemic. It is important to note that the Fall 2021 standardized exams differed from their predecessors. For instance, 2021’s tests were notably shorter than in previous years and were administered in the Fall instead of the Spring. Additionally, fewer students participated in last year’s exams, with only about 91% of eligible students testing compared to 2018-2019’s 97%.


Overall Report Card Scores in Snohomish County Schools
The proficiency scores across the three core subjects were averaged to give each district an overall ranking. The school districts ranked, from highest scores to lowest, as follows:
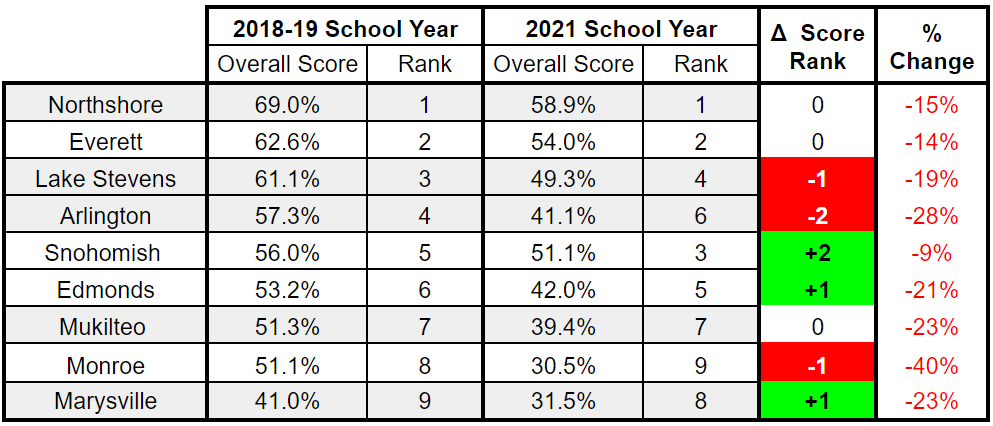
From the data, overall proficiency scores for all Snohomish County school districts dropped between 9 to 40 percent. The Snohomish School District experienced the least disruption in proficiency scores with a 9 percent drop, whereas the Monroe School District experienced the greatest at 40 percent and is now ranked the lowest in Snohomish County. Both Northshore School District and Everett Public Schools retained their top 1 and 2 ranking respectively; however, Snohomish School District jumped from fifth to third this year surpassing both Lake Stevens and Arlington who dropped to fourth and sixth respectively. Edmonds School District increased its ranking to the number five spot of the nine school districts in the county.
It is interesting to note that both the Marysville and Monroe school districts that have been marred in controversy have ranked at the bottom of the list and this may indicate to what degree the role of a superintendent influences the overall educational proficiency of students. Both of these school districts lacked a superintendent for months, and in the case of Marysville, an entire year.
In September of 2021, the Marysville School Board accepted the resignation of District Superintendent Jason Thompson following a 6-month medical leave and in December of the same year, Monroe School District Superintendent Dr. Justin Blasko was placed on administrative leave and officially resigned in July of 2022. In March of 2022, Zachary Robbins was unanimously approved by the Marysville School Board as its district’s new superintendent. The Monroe School District is currently in search of a new superintendent.
The data in Table 2 below reflects a calculation on the average of all school districts to determine a performance metric for Snohomish County school districts and should not be used to determine the true proficiency of all students in Snohomish County schools. For example, if a county had two districts, District A with 100 students and a score of 75, and District B with 10 students and a score of 100, the calculation used in Table 2 would equate to a metric of 87.5 for an overall county district score. However, the true proficiency score for all students in the scenario mentioned would be 77.27 because districts A and B have different a number of students.
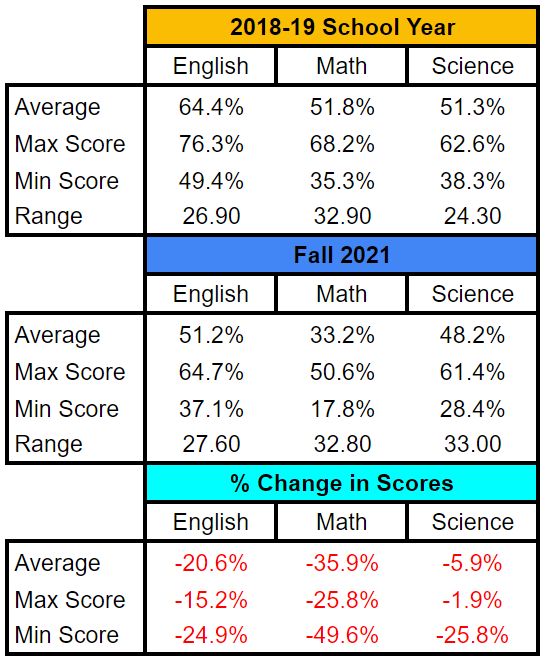
According to Table 2 for all Snohomish County School Districts, English dropped by 20.6 percent, Math dropped by 35.9 percent and Science dropped by 5.9%. What was surprising is that the range of proficiency scores for both English and Math stayed relatively the same, indicating a true downward shift to the mean proficiency scores from the 2018-19 school year. Math scores appeared to have suffered greatly, a 25.8 percent drop in the highest score to an almost 50 percent drop in the lowest scoring district.
The 2019-20 per-pupil expenditures for Snohomish County Schools have been ranked from highest to lowest as follows:
- Marysville, $16,497
- Mukilteo, $16,233
- Everett, $15,623
- Edmonds, $15,257
- Snohomish, $14,836
- Northshore, $14,646
- Arlington, $14,197
- Monroe, $14,063
- Lake Stevens, $13,881
Many of the districts have seen increases in their annual budgets, some of which are a result of the 2012 McCleary decision. The decade-long battle ended in June of 2018 when the state came into compliance with the Supreme Court after funneling billions of dollars into public education.
The 2020-21 annual budgets are given below, followed by the budget increases since 2018:
- Mukilteo: $289,790,128 (increased $42,136,804).
- Edmonds: $360,400,000 (increased $38,779,253).
- Everett: $358,243,167 (increased $37,236,930).
- Lake Stevens: $146,559,776 (increased $24,144,112).
- Snohomish: $154,830,615 (increased $3,003,462).
- Marysville: $176,142,760 (increased $9,263,315).
- Northshore: $404,522,307 (increased $58,522,307)
- Arlington: $86,993,411 (increased $11,529,266)
- Monroe: $100,416,001 (increased $7,433,031)
The Breakdown: Snohomish County Schools
Because teachers are on the front lines of this new challenge, the Lynnwood Times reached out to each district included in the above tables to inquire how the pandemic and other potential factors contributed to the lower scores and what their plan is moving forward to help students reach proficiency. Of the nine districts contacted, only five replied to the email, and due to some school officials being out of office, only four were able to respond to our inquiry.
This is an ongoing story, and any district responses will be included in future reports.
Edmonds School District
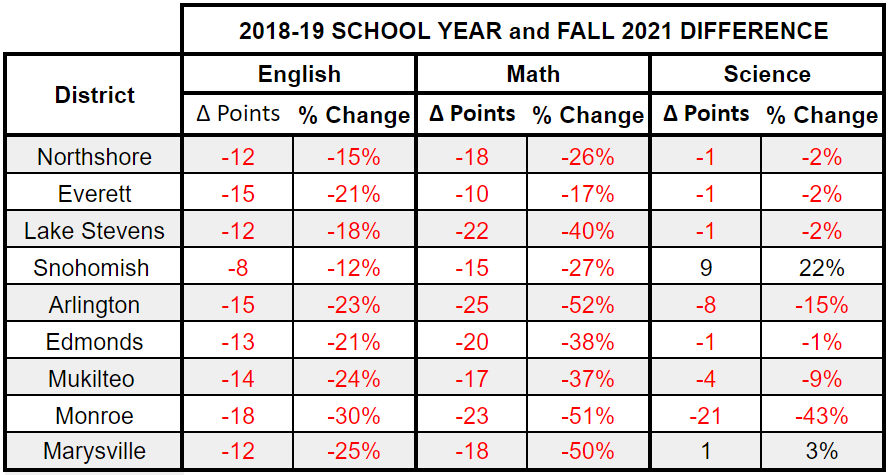
The Edmonds School District had a 13-point (23%) decrease in the number of students who met or exceeded standards in English, a 20-point (38%) decrease in Math, and only a 1-point (1%) decrease in Science.
When asked what led to these results, Edmonds School District Communications Manager Harmony Weinberg said, “It is certainly hard not to say that the time spent in remote learning from March 2020 to April 2021 and even time spent in hybrid learning from April 2021 to the end of the school year had an impact on our students’ ability to demonstrate mastery of key content in Math and Literacy.”
Weinberg also noted the difficulties students faced when in-school learning finally did return for the 2021-22 school year, including long quarantine periods and classroom disruptions caused by teacher shortages.
Speaking to the deeper impact of the last two years, Weinberg continued, “we know that our students and families were impacted in a myriad of ways by the pandemic including economically and social emotionally. We anticipate that students will continue to need social-emotional and mental health supports for some time to come as they grapple with the impacts of the pandemic.”
“None of these factors are intended to be excuses as we absolutely hold ourselves accountable for these gaps in learning,” Weinberg concluded, “but they did play a role in the kinds of test scores we are seeing now.”
Moving forward, the Edmonds School District is using “more frequent formative data from diagnostic assessments” to gauge where the learning gaps are and will develop additional support plans from there.
This summer, the district implemented an in-person summer school program for all grades to meet student learning needs, specifically for Math and Literacy skills. For K-8 students, the district used diagnostic assessment data to determine which students had the greatest need and invited them to participate in the summer program.
Snohomish School District
With a 9-point (22%) increase in the number of students who met or exceeded standards in Science, the Snohomish School District is an outlier in this case. The district also had the smallest decrease in English compared to the other eight districts, with only an 8-point (12%) difference compared to 2018-19. But similar to the other districts, Snohomish saw its largest decrease in Math, with 42% of students meeting standards compared to 2018-19’s 57%.
According to Kristin Foley, the district’s Communication Director, the OSPI has instructed districts not to compare this latest round of test scores to data from the Spring due to all the previously mentioned variables.
“The fall test was a different test given at a very different time,” Foley reiterated. “We do not believe the results mean our students are cognitively lower. We believe that during the pandemic, students did not have exposure to specific skills, especially the skill of being a student and taking rigorous online exams.”
Foley also said that last fall was a difficult transition for students as “social, emotional, and behavioral adjustments were still being made when we took the test.”
Ultimately, the Snohomish School District believes that “students need to be taught and given the opportunity to practice being a student.”
Further indicating that remote learning did not provide an adequate opportunity for such practice, Foley said the district’s plan is to “keep students in school” to improve academic competency.
“We will continue to focus on research-based instructional practices and will continue to use data to guide our instruction,” she explained. “We are focusing on meeting our students’ social and emotional needs and teaching behaviors to help all students be successful in school.”
The Snohomish School District has also held additional summer academic and after-school programs geared toward students “who would most benefit from the programs.”
Northshore School District
Even the Northshore School District, which has ranked highest among these nine districts for its academic achievement for years, was not immune to the pandemic’s challenges. The district had a 12-point (15%) decrease in the number of students that met standards in English, an 18-point (18%) decrease in Math, and only a 1-point (2%) decrease in Science.
The district responded to the Lynnwood Time’s inquiry with the following statement:
“Northshore School District continues to significantly outperform the state across all academic measures despite unprecedented challenges as a result of the pandemic. As Washington State works to recover, Northshore will continue to do what we do best – provide engaging and high-quality learning opportunities for our students.”
After noting how all districts in the state were required to submit an Academic and Student Well-being Recovery Plan to the OSPI last year, Northshore stated that it is “committed to increasing supports to address the social and emotional wellness of students and provide enhanced academic services to students that need them.”
“We look forward to a strong 2022-23 school year and supporting the learning, growth, and excellence of every student.”
Arlington School District
In Fall 2021, only 24% of students in the Arlington School District met or exceeded Math standards, which is half the amount of its pre-pandemic numbers. The district also had 23% fewer students (a 15-point drop) meet standards for English compared to 2018-19, and 15% fewer (an 8-point drop) for Science.
“Of course, the primary cause for the drop in test scores was closure and hybrid scheduling due to the pandemic,” Kari-Henderson Burke explained, the district’s Executive Director of Teaching and Learning.
Burke expressed the district’s excitement for the return of its traditional schedule this coming year. “It is important to remember that, though the schedule was ‘normal’ [last year], we were still impacted by a high volume of absences due to Covid, which of course significantly impacted student learning,” she added.
To improve academic achievement, Burke said the Arlington School District has already implemented a new math curriculum for high school and middle school students. “Each of these materials sets teaches math as lively, social, and active; as a means to solve real-world problems,” she explained.
Burke added that the implementation of the new curriculum has been “bumpy” for reasons already stated. “We have progress to make,” she concluded.
The pandemic led to a global increase in Learning Poverty
The pandemic’s impact on children’s education cannot be understated. Schools in Snohomish County, Washington State, and even across the United States are not the only ones that have been negatively affected. The pandemic has proven to be a global hindrance to student learning and academic achievement, especially in lower-income countries.
The World Bank is a global partnership working to reduce poverty and build shared prosperity in developing countries. Last month, the partnership published a report stating that 70% of 10-year-olds in the world are “unable to understand simple written text.”
In 2021, The World Bank developed a concept known as “Learning Poverty,” which essentially means “being unable to read and understand a simple text by age 10.” The partnership penned the concept to have a succinct way of explaining the long-lasting impacts being illiterate can have at a young age. Referring to some of those impacts, the partnership states that reading is “a gateway for learning” and that the inability to read “slams that gate shut.”
When children can’t read, according to the World Bank, it is also an “indication that school systems aren’t well organized to help children learn in other areas such as math, science, and the humanities.”
According to The World Bank, Learning Poverty has increased (more students are unable to understand simple written text) by a third in low- and middle-income countries compared to pre-pandemic data. “Prolonged school closures and unequal mitigation strategies have worsened learning inequality among children,” states The World Bank.
Continuing with how school closures affected academic achievement, the partnership states, “Children with the most fragile grasp of foundational literacy before the closures are most likely to have suffered larger learning losses.”
“Without strong foundational skills, children are unlikely to acquire the technical and higher-order skills needed to thrive in increasingly demanding labor markets and more complex societies.”
To read The World Bank’s Learning Poverty 2022 update in its entirety, click here.

Author: Bo John Brusco