The Consumer Price Index for All Urban Consumers (CPI-U) was unchanged in July on a seasonally adjusted basis after rising 1.3 percent in June, the U.S. Bureau of Labor Statistics reported August 10. Over the last 12 months, the all items index increased 8.5 percent before seasonal adjustment.
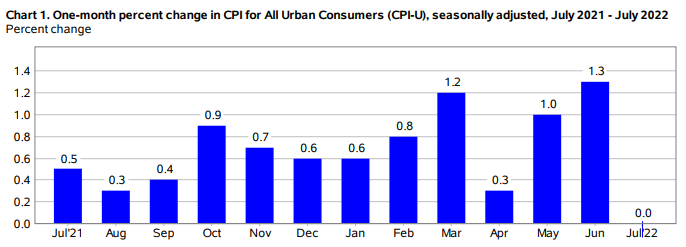
The gasoline index fell 7.7 percent in July and offset increases in the food and shelter indexes, resulting in the all items index being unchanged over the month. The energy index fell 4.6 percent over the month as the indexes for gasoline and natural gas declined, but the index for electricity increased. The food index continued to rise, increasing 1.1 percent over the month as the food at home index rose 1.3 percent.


The index for all items less food and energy rose 0.3 percent in July, a smaller increase than in April, May, or June. The indexes for shelter, medical care, motor vehicle insurance, household furnishings and operations, new vehicles, and recreation were among those that increased over the month. There were some indexes that declined in July, including those for airline fares, used cars and trucks, communication, and apparel.
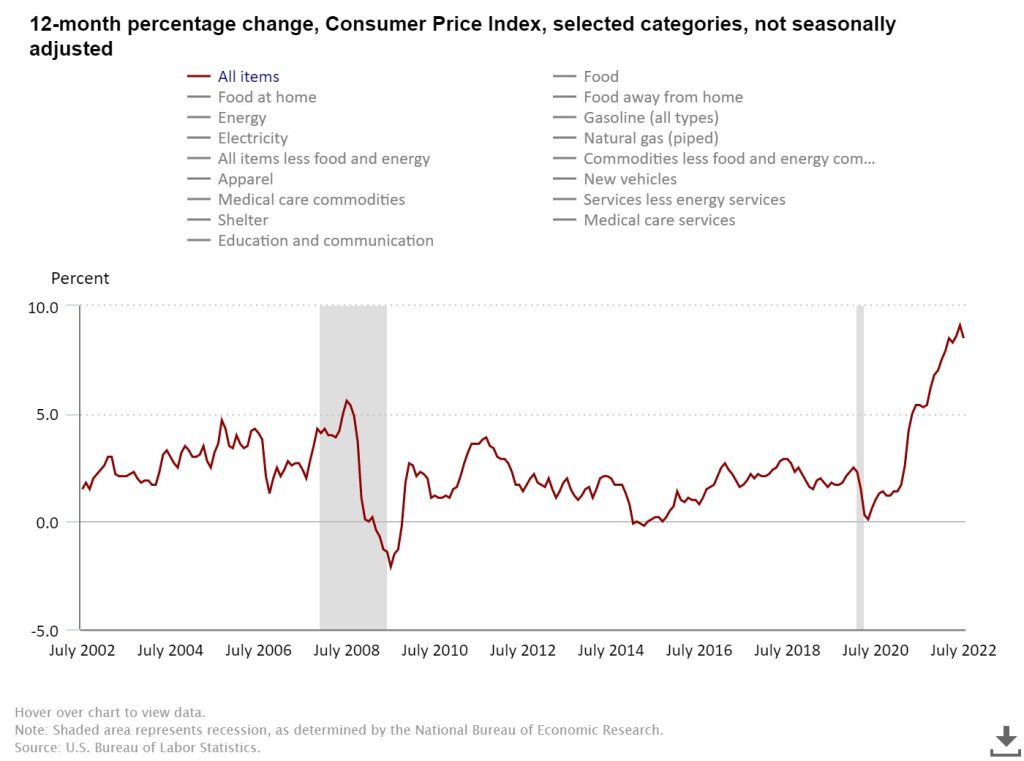
The all items index increased 8.5 percent for the 12 months ending July, a smaller figure than the 9.1-percent increase for the period ending June. The all items less food and energy index rose 5.9 percent over the last 12 months. The energy index increased 32.9 percent for the 12 months ending July, a smaller increase than the 41.6-percent increase for the period ending June. The food index increased 10.9 percent over the last year, the largest 12-month increase since the period ending May 1979.


Real Earnings Summary
Real average hourly earnings for all employees increased 0.5 percent from June to July, seasonally adjusted, the U.S. Bureau of Labor Statistics reported August 10. This result stems from an increase of 0.5 percent in average hourly earnings combined with no change in the Consumer Price Index for All Urban Consumers (CPI-U).
Real average weekly earnings increased 0.5 percent over the month due to the change in real average hourly earnings combined with no change in the average workweek.
Real average hourly earnings decreased 3.0 percent, seasonally adjusted, from July 2021 to July 2022. The change in real average hourly earnings combined with a decrease of 0.6 percent in the average workweek resulted in a 3.6-percent decrease in real average weekly earnings over this period.
Production and nonsupervisory employees
Real average hourly earnings for production and nonsupervisory employees increased 0.5 percent from June to July, seasonally adjusted. This result stems from a 0.4-percent increase in average hourly earnings combined with a decrease of 0.1 percent in the Consumer Price Index for Urban Wage Earners and Clerical Workers (CPI-W).
Real average weekly earnings increased 0.5 percent over the month due to the change in real average hourly earnings being combined with no change in average weekly hours.
From July 2021 to July 2022, real average hourly earnings decreased 2.7 percent, seasonally adjusted. The change in real average hourly earnings combined with a decrease of 0.9 percent in the average workweek resulted in a 3.5-percent decrease in real average weekly earnings over this period.
Producer Price Index News Release summary
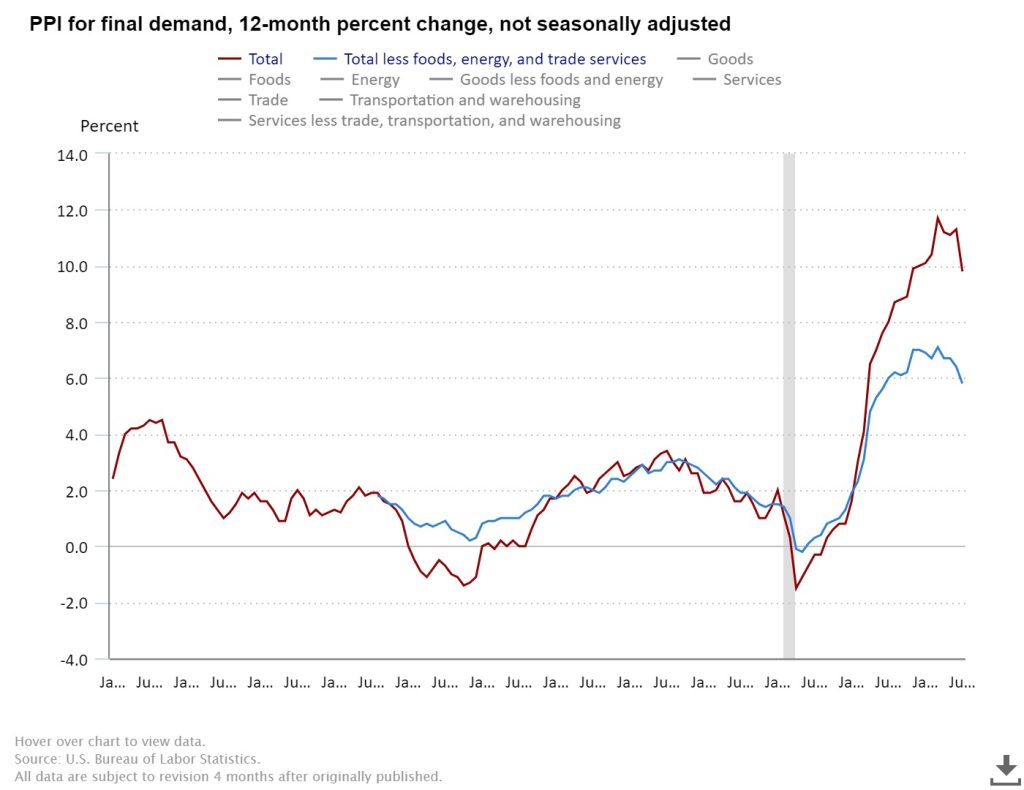
The Producer Price Index for final demand fell 0.5 percent in July, seasonally adjusted, the U.S. Bureau of Labor Statistics reported August 11. This decline followed advances of 1.0 percent in June and 0.8 percent in May. (See table A.) On an unadjusted basis, final demand prices moved up 9.8 percent for the 12 months ended in July.
In July, the decrease in the index for final demand is attributable to a 1.8-percent decline in prices for final demand goods. In contrast, the index for final demand services advanced 0.1 percent.
Prices for final demand less foods, energy, and trade services moved up 0.2 percent in July following a 0.3-percent rise in June. For the 12 months ended in July, the index for final demand less foods, energy, and trade services increased 5.8 percent.
Final Demand
Final demand goods: The index for final demand goods fell 1.8 percent in July, the largest decline since moving down 2.7 percent in April 2020. The July decrease can be traced to a 9.0-percent drop in prices for final demand energy. Conversely, the indexes for final demand foods and for final demand goods less foods and energy rose 1.0 percent and 0.2 percent, respectively.
Product detail: Eighty percent of the July decline in the index for final demand goods is attributable to gasoline prices, which fell 16.7 percent. The indexes for diesel fuel, gas fuels, oilseeds, iron and steel scrap, and grains also moved lower. In contrast, prices for chicken eggs jumped 43.1 percent. The indexes for industrial chemicals and for electric power also increased.
Final demand services: The index for final demand services inched up 0.1 percent in July, the third consecutive increase. Leading the July advance, margins for final demand trade services rose 0.3 percent. (Trade indexes measure changes in margins received by wholesalers and retailers.) Prices for
final demand transportation and warehousing services moved up 0.4 percent. Conversely, final demand services less trade, transportation, and warehousing decreased 0.1 percent.
Product detail: Leading the July increase in prices for final demand services, margins for fuels and lubricants retailing rose 12.3 percent. The indexes for services related to securities brokerage and dealing (partial), hospital outpatient care, automobiles and automobile parts retailing, and transportation of passengers (partial) also moved higher. In contrast, prices for portfolio management declined 7.9 percent. The indexes for securities brokerage, dealing, and investment advice; food and alcohol retailing; and long-distance motor carrying also fell.
U.S. Import and Export Price Indexes summary
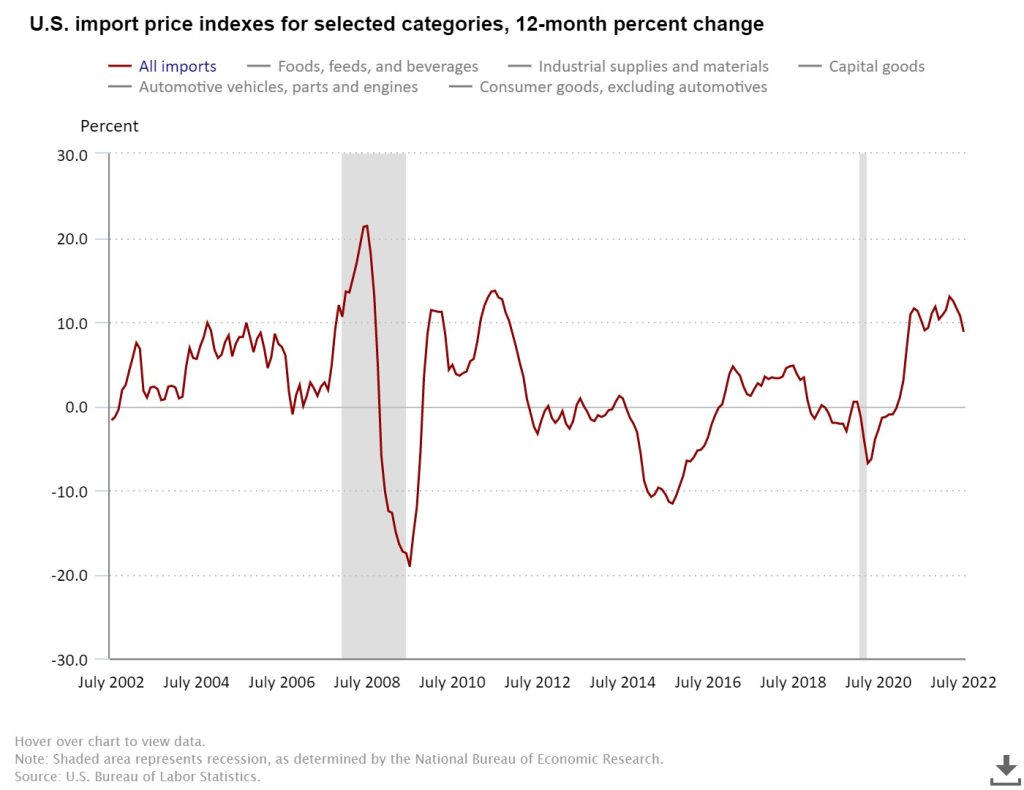
U.S. import prices decreased 1.4 percent in July, after advancing 0.3 percent in June, the U.S. Bureau of Labor Statistics reported August 12. Lower fuel and nonfuel prices in July contributed to the decline in U.S. import prices. The price index for U.S. exports fell 3.3 percent in July following a 0.7-percent advance the previous month.
Imports
Prices for U.S. imports declined on a monthly basis in July for the first time since December 2021, decreasing 1.4 percent. The decline was the largest drop in import prices since the index fell 2.6 percent in April 2020. U.S. import prices rose 8.8 percent over the past 12 months, the smallest over-the-year increase since the index advanced 7.1 percent from March 2020 to March 2021.
Fuel Imports: Import fuel prices declined 7.5 percent in July following 6.2-percent increases in June and May. The July decrease was the first 1-month drop since a 7.7-percent decline in December 2021. Despite the July drop, import fuel prices advanced 56.6 percent over the past year. Lower prices for petroleum and natural gas contributed to the July decline in import fuel prices. Petroleum prices fell 6.8 percent, after rising 5.9 percent in June and 5.4 percent in May. Natural gas prices decreased 20.6 percent following a 54.3-percent advance in the second quarter of 2022. The July decline was the largest monthly drop in natural gas prices since a 22.1-percent decrease in June 2019. Prices for petroleum increased 56.6 percent for the year ended in July and natural gas prices rose 69.8 percent over the same period.
All Imports Excluding Fuel: The price index for nonfuel imports fell for the third consecutive month, decreasing 0.5 percent in July, after declines of 0.6 percent in June and 0.3 percent in May. The July drop was driven by lower prices for nonfuel industrial supplies and materials; and foods, feeds, and beverages, which more than offset higher prices for automotive vehicles and capital goods. Despite the recent declines, nonfuel import prices advanced 4.1 percent over the past year.
Foods, Feeds, and Beverages: Foods, feeds, and beverages prices fell 0.9 percent in July following 0.7-percent and 0.6-percent decreases in June and May, respectively. The July decline was the largest 1-month drop since November 2020. The monthly decrease was led by lower prices for fish and shellfish; and food oils and oilseeds which more than offset higher vegetable and bakery product prices.
Nonfuel Industrial Supplies and Materials: Prices for nonfuel industrial supplies and materials fell 2.6 percent in July, after decreasing 2.3 percent in June. The July drop was the largest monthly decline since the index fell 3.3 percent in April 2020. Lower prices for unfinished metals, finished metals, selected building materials, and chemicals drove the July decline in nonfuel industrial supplies and materials prices.
Finished Goods: Prices for most of the major finished goods categories were up in July. Automotive vehicles prices advanced 0.6 percent following a 0.3-percent increase in June. Higher prices in July for passenger cars led the advance in automotive vehicles prices. The price index for capital goods increased 0.2 percent in July, after no change the previous month. The July rise in capital goods prices was driven by higher prices for industrial and service machinery. Prices for consumer goods were unchanged in July, after decreasing 0.4 percent in June.
Exports
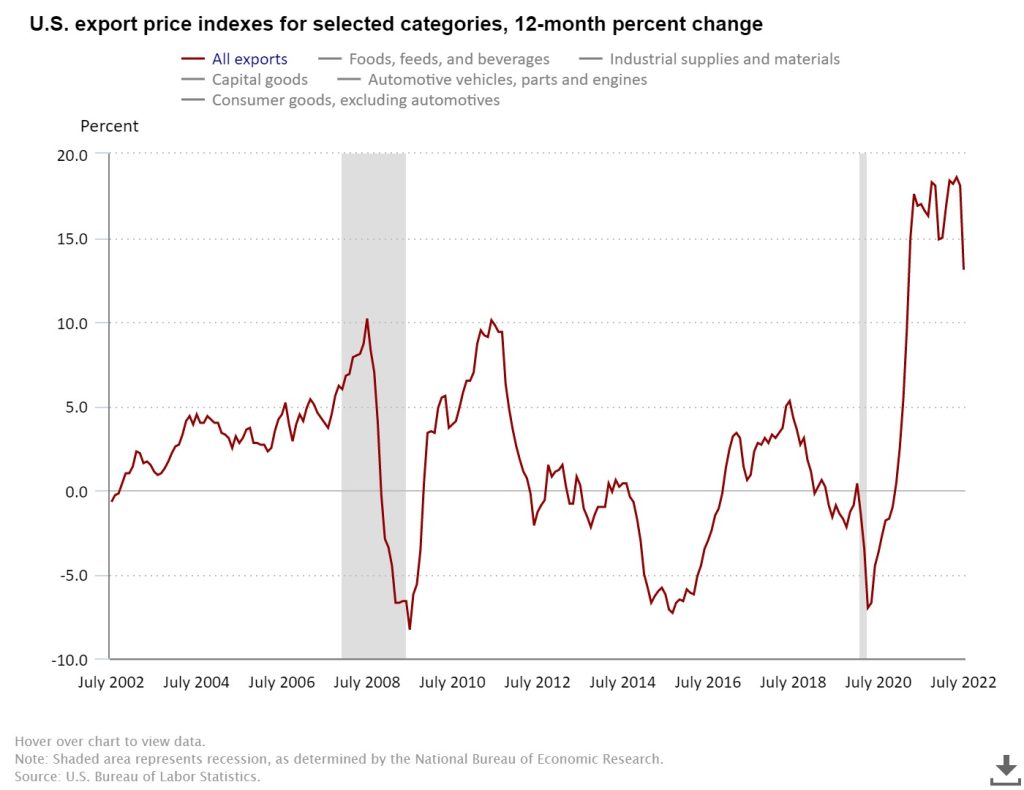
U.S. export prices fell 3.3 percent in July, after rising 0.7 percent in June. The July decline was the largest 1-month decrease since the index fell 3.5 percent in April 2020. Lower agricultural and nonagricultural prices each contributed to the July decline. Prices for U.S. exports rose 13.1 percent over the past year, the lowest 12-month advance since the index increased 9.6 percent in March 2021.
Agricultural Exports: The price index for agricultural exports fell 3.0 percent in July, after edging down 0.1 percent the previous month. The July decline was the largest monthly drop since the index decreased 3.3 percent in April 2020. Lower prices for soybeans, wheat, and cotton in July led the decline in agricultural prices. Despite the July decrease, agricultural export prices rose 13.3 percent over the past 12 months.
All Exports Excluding Agriculture: Prices for nonagricultural exports decreased 3.3 percent in July, after advancing 0.8 percent in June and 2.8 percent in May. The July decline was led by lower prices for nonagricultural industrial supplies and materials; consumer goods; and nonagricultural foods which more than offset higher prices for capital goods and automotive vehicles. Nonagricultural export prices increased 13.1 percent over the past year.
Nonagricultural Industrial Supplies and Materials: Nonagricultural industrial supplies and materials prices fell 7.0 percent in July, the first monthly decline since December 2021 and the largest decrease since a 10.4-percent drop in April 2020. The July decrease was driven by a 12.3-percent decline in fuel prices, the largest 1-month decrease since a 29.5-percent drop in April 2020.
Finished Goods: Prices were mostly up for the major finished goods categories in July. Capital goods prices increased 0.8 percent following no change the previous month. The July advance was the largest monthly increase since the index rose 0.9 percent in January 2022. Automotive vehicles prices advanced 0.6 percent in July, led by higher prices for engines and engine parts. In contrast, consumer goods prices edged down 0.1 percent for the second consecutive month in July.

Author: Lynnwood Times Staff